Jan 8, 2018
Larry Berman: What are the odds of a melt up before a melt down?
By Larry Berman
Jeremy Grantham, co-founder of GMO LLC, one of Europe’s large value managers made the case last month that the final stage of the bull market could see a massive melt up.
Grantham has studied all historical bubbles and is regarded as an expert in the field. The main message is that no two bubbles are created equal, but they do have similarities.
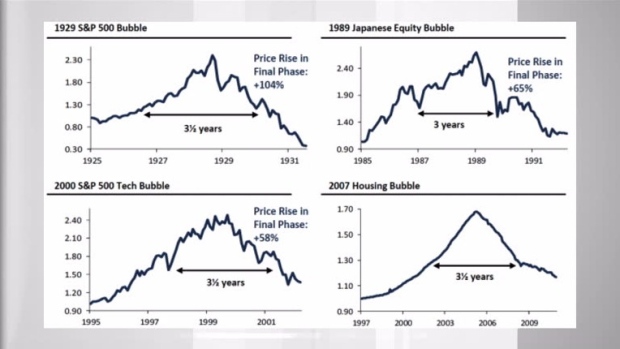
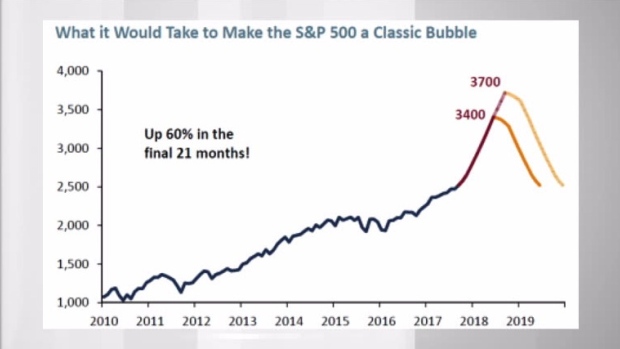
Grantham suggests that the average final bubble phase takes 3.5 years with the real acceleration phase about 21 months. If we measure the launch point from the 2106 U.S. presidential election, we have about eight months left if the acceleration phase is average. He projects a target range of 3400-3700 as a final peak for the S&P 500 before a 50 per cent (or so) correction takes the markets back to election night lows. The S&P 500 closed at 2,140 on election night. A 60 per cent melt up from that point takes us to about 3,400-3,700.
There are other factors that give indications of a blow-off top as well. One is market breadth, the number of stocks that are rising versus falling. Historically, the advance decline line, shows a divergence before a top forms... That is, most stocks are falling well before the market top develops. This happens in capitalization weighted indexes where a few stocks (think FAANG or the Nifty 50 back in the 1960s) lead the market indexes narrowly higher.
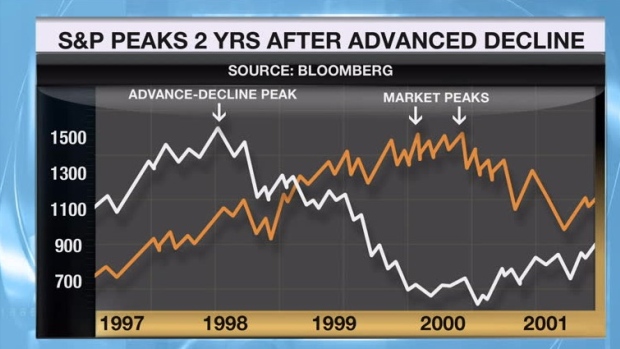
At many major market tops over the decades, we have seen these divergences. One thing that might be a bit different this time around is the prominence of ETFs. When trillions of dollars move out of traditional mutual funds and end up in ETFs, you will see the breadth statistics skew. The creation of new units in the ETFs demands the purchase of all the stocks the index tracks. This should have the effect of making the number of stocks advancing improve, albeit with less volume per share. Historically, the last phase of the rally is about money concentrating in a smaller number of stocks while the broader market does not perform as well. The advance decline line is not currently showing a problem. Largely because the tax cuts are going to benefit most companies and smaller more domestic companies, too, rather than the larger multinationals that have been using tax strategies to lower their effective rates for decades.
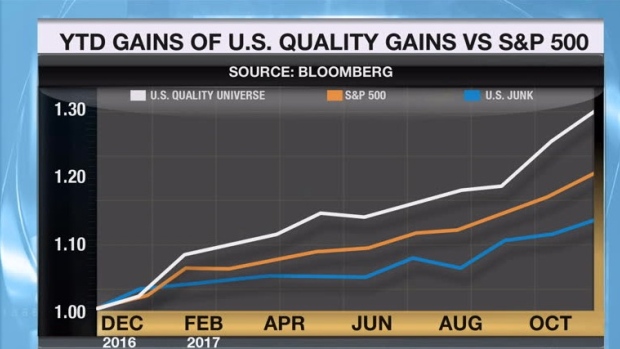
The final chart we will look at shows GMO Quality stocks against the Junk stocks. More money is going into the higher quality stocks with superior earnings and stronger balance sheets. While this pattern is typically evident in the blow-off phase, it’s not yet extreme compared to other bubbles.
Grantham notes that other asset classes like bitcoin and housing affordability is exhibiting bubble signals as well. At peaks in 1929 and 1987, valuations were extreme. The S&P 500 whistled past these extremes where trailing earnings were about 25 times peaking out closer to 35 times earnings. Valuation alone is not enough of an indicator to suggest when the market will ultimately top out.
Make no mistake, when it finally breaks, it’s going to be painful on the other side. No need to run to cash now, but I’ve been advocating a continued shift to defensive ways to play the market. That view has not changed, though like Grantham, I was too early in getting defensive. If we should see a 3,000-plus level for the S&P 500 later this year, cash might become a better place to put your money if the Federal Reserve and Bank of Canada continue to raise rates.
Follow Larry Online:
LinkedIn Group: ETF Capital Management
Facebook: ETF Capital Management
Web: www.etfcm.com


