Jun 19, 2017
Infrastructure bank must battle 'bad track record' on demand: C.D. Howe
, BNN Bloomberg

Canada’s new infrastructure bank has the potential to significantly improve key projects, but the success of these projects requires responsibility and better usage forecasting on the municipal and provincial levels, according to a new report from the C.D. Howe Institute.
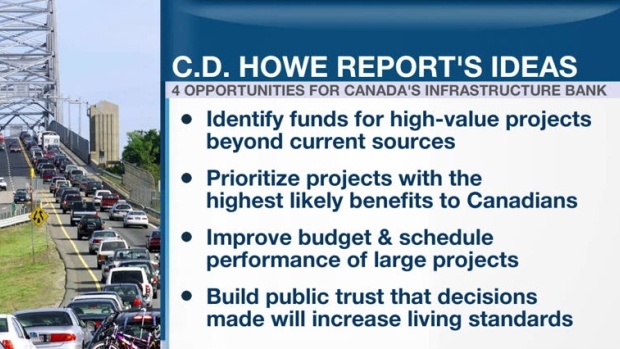
In a report titled ‘Banking on Infrastructure: How the Canada Infrastructure Bank can Build Infrastructure Better for Canadians’ C.D. Howe argues that the bank can open up new funding sources for future projects.
The report’s author, Steven Robins, joined BNN on Tuesday and said that the government’s track record on predicting demand needs improvement.
“The government has a bad track record of predicting [demand] and I think that the Canadian government is no different than when other academics have studied this problem worldwide. When you are trying to get an infrastructure project approved there are a whole bunch of competing proposals and the one that is the most optimistic tends to be the one that gets approved,” Robins told BNN.
“What we’re hoping the infrastructure bank can do is encourage the transfer of how many people use this project to the private sector.”
Robins also believes that a critical eye towards these projections can result in the Canadian government producing a better finished project.
“When an investor comes in and says: ‘We actually don’t think you’re going to get 100,000 people riding that transit line every day’, then the government’s going to be forced to say: ‘Is this the right project? Should we build it smaller and save money on the construction cost? … Should we consider a different project?’” Robins said.
The report included a table of 10 major Canadian infrastructure projects that accounted for an average of 17 per cent less demand than forecasts. Toronto’s Sheppard subway was the worst of the lot with 64 per cent less traffic than a 2015 traffic estimate. Montreal’s Autoroute 30, meanwhile, did 67 per cent more vehicles than a 2013 estimate.
The Institute expressed concern over the bank’s governance role in the projects it seeks to fund.
“How much independence should you give this bank?” Robins told BNN. “What we argue for in the report is that there’s a really important role for the government at the start of the process. When you’re deciding: Are we going to invest in transit? Are we going to invest in housing? Are we going to invest in British Columbia or in the Maritimes? That’s when the politicians should be involved in deciding what projects are we going to fund and how much are we willing to spend on them.”
“Once the government’s made that decision they need to step back and let the bank go out and say: ‘Is this a good deal?’”
At the same time, the report makes it clear that provinces and municipalities will still do the heavy lifting once the federal bank is up and running.
“The bank will need to operate in Canada’s federal system – where provinces and municipalities deliver the vast majority of infrastructure. However, the information generated by engaging the private sector through the bank will benefit decisionmakers at all levels.”
The infrastructure bank, first unveiled during last fall’s economic update will be headquartered in Toronto. BNN reported last week that a special advisor has made a recommendation on who should serve as chair.
Demand vs. Forecast on Canadian Infrastructure Projects
| Project (Date of Est. Traffic) |
Cost | Units | Current Traffic |
Forecast Traffic |
% Demand vs. Forecast |
|---|---|---|---|---|---|
| Toronto Sheppard Subway (2015) |
$934M | Peak Hour Passengers |
5,000 | 14,000 | - 64 |
| Toronto UP Express (2017) |
$456M | Revenue $M |
20.8 | 29.3 | - 29 |
| Vancouver Port Mann Bridge (2017) |
$3.3B | Vehicles/Day |
112,000 | 150,000 | - 25 |
| Vancouver Golden Ears Bridge (2014) |
$808M | Vehicles/Day |
32,055 | 68,000 | - 53 |
| Vancouver Evergreen Line (2017) |
$1.431B | Daily Riders |
30,000 | 50,000 | - 40 |
| Calgary West LRT (2013) |
$1B | Weekday Ridership |
32,400 | 35,000 | - 7 |
| Montreal Mascouche Line (2015) |
$479M | Weekday Ridership |
6,400 | 11,000 | - 42 |
| Mississauga BRT (2015) |
$320M | Weekday Ridership |
13,600 | 13,700 | - 1 |
| Vancouver Canada Line (2015) |
$2B | Weekday Ridership |
122,000 | 100,000 | + 22 |
| Montreal Autoroute 30 (2013) |
$1.5B | Vehicles/Day |
20,000 | 12,000 | + 67 |
| Average | $1.223B | - 17 |


