May 16, 2016
Larry Berman: Deconstructing the head and shoulders trend
By Larry Berman

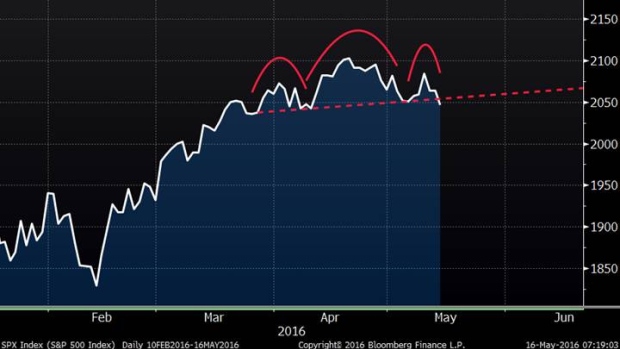
ANALYSIS: You will start to hear about a head and shoulders pattern forming on the S&P 500 this week. I wanted to look at the pattern, what is happening in the market as it is forming, and the probability it plays out and what you should do about it. Thomas Bulkowski has a great website to help understand chart patterns and what they mean. Bulkowski defines the head and shoulders top as follows:
HEAD AND SHOULDERS
| Characteristic | Discussion |
|---|---|
| Price trend | Upward leading to the pattern. |
| Shape | Looks like a head perched atop two shoulders. A three-peak pattern with the middle peak above the others. The pattern should look like a person’s head and shoulders, proportional, and not lopsided. |
| Symmetry | The two shoulders should peak near the same price, be nearly the same distance from the head, and look similar (both wide or both narrow peaks). |
| Volume | Highest on the left shoulder followed by the head. Trends downward 63 per cent of the time. |
| Neckline | Joins the two armpits. |
| Confirmation | The pattern confirms as a valid one when price closes below an up-sloping neckline or below the right armpit when the neckline slopes downward. |
The idea of the pattern is the identification of the end of a rising trend of higher highs and higher lows – and the beginning of a correction process of lower highs and lower lows. The target price for the pattern is measured from the head of the pattern to the neckline, and that is projected on to the break of the neckline.
Bulkowski has tested this pattern compared to all other major technical pattern formations and it shows the best efficacy. The target for this pattern is about 1965, which is very close to the 50 per cent correction from the Feb. 11 low of 1810 to the April 20 high of 2111 at 1961. History shows that it only hits its price target about 55 per cent of the time, according to Bulkowski.
Important bull market results for head-and-shoulder tops
Overall performance rank (1 is best): 1 out of 21
Break even failure rate: 4%
Average decline: 22%
Pullback rate: 50%
Percentage meeting price target: 55%
Head-and-shoulders top trading tips
| Trading Tactic | Explanation |
|---|---|
| Measure rule | Compute the height from the head to the neckline directly below then multiply it by the above "percentage meeting price target." Subtract the result from the breakout price. The breakout price is where price crosses an up-sloping neckline, or when the neckline slopes downward, use the right shoulder armpit. |
| Price reversal | Price must have something to reverse, so if the rise leading to the pattern is small, expect a small decline. |
| Confirmation | Wait for confirmation before placing a trade. |
| Trends | A short-term rise leading to the pattern results in the best post breakout performance. |
| Velocity | A high velocity rise leading to the pattern often results in a larger decline post breakout. |
| Neckline | Patterns with up-sloping necklines perform better. The Measure Rule figure shows a green up-sloping neckline. |
| Shoulder | A higher left shoulder peak when compared to the right shoulder top results in a larger decline post breakout. The Shoulder Peak figure to the right shows this. |
| Yearly high | Patterns within a third of the yearly high perform worst, but the differences are slight. |
| Volume trend | An upward volume trend suggests better post breakout performance. |
| Pullbacks | Pullbacks hurt post breakout performance. |
| Symmetry | Patterns with an extended right shoulder perform worse. Symmetrical looking patterns also perform worse. |
Bottom line: Do not liquidate all your stock holdings. Trying to be all in or all out is a bad idea. For those looking to put money to work in the coming weeks, the closer we are to the 1960 area of the market the better the support is likely to be. For those who think a deeper correction is likely, my guess would be in October where we could see lower lows than we saw earlier in the year.
Thanks to all those who came out to the recent roadshow. With help from partners and sponsors, our fundraising for Alzheimer’s research this year exceeded $70K. Over the past four years, Berman’s Call viewers have helped raise over $174,000 for Alzheimer’s research in Canada. What we are learning from this important research is expected to defer the onset of dementias for a decade or more with some healthy lifestyle choices basically minimizing the impact to society.
-
Follow Larry Online:
LinkedIn Group: ETF Capital ManagementFacebook: ETF Capital Management


