May 9, 2016
Peter Brieger's Top Picks: May 9, 2016
, BNN Bloomberg

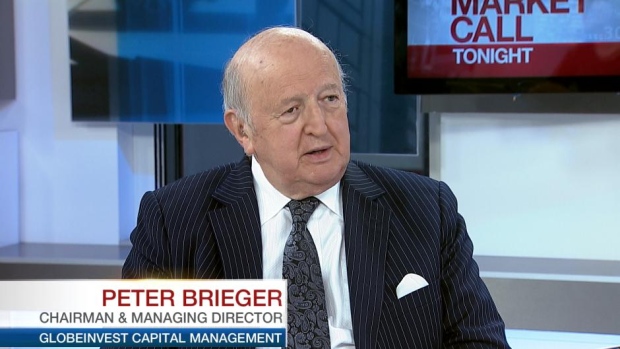
Peter Brieger, chairman & managing director, GlobeInvest Capital Management
Focus: North American Large Caps
MARKET OUTLOOK:
Short-Term: (Three months): Since their January and February swoons, Canadian and U.S. markets have recovered. For example, as of last Friday’s closes, the TSX had recovered to levels above its December 31, 2015 close while the S&P 500 reached its year-end level and has been in a trading range since. From a purely technical view, neither market’s index looks ready to break down. The TSX Relative Strength Index (“RSI”) stands at 52.43 relative to an over-bought (“OB”) reading of 70.0 while the S&P 500 RSI stands at 47.27 relative to an OB reading of 60. In the U.S. the Investor Intelligence Bull Bear Ratio stands at just under 2.0, the mid-point between an over-valuation reading of 3.0 and an under-valuation of under 1.0. Looking ahead the 2017 estimated price-earnings ratio are 14.9 for the TSX and a consensus 15.1 for the S&P 500. This compares to the long-term averages of 17.1 and 13.9 respectively. As of last Friday, the TSX stock yields of about 3.0 percent exceeded nominal Canadian Federal government bond yields for all maturities while in the U.S. the S&P 500 yield of 2.21 percent exceeded US Treasury yields for maturities from 2 to 10 years. Given the decline in nominal yields in Q1 for most government bond maturities and given recent “Fed speak,” it is hard to see bonds (higher rates) challenging equities in the immediate future.
In currency markets all eyes are on the U.S. dollar as measured by the DX/Y, as of last Friday it had declined 4.9 percent from year-end and 6.6 percent from its late 2015 high. Where it goes from here in is no small part a function of US interest rates which will be a function on US CPI going forward. Excluding energy, the latest U.S. CPI reading was 2.0 percent compared to the overall reported CPI of 0.9 percent. If the energy component stops going down as it did last month, it implies a potential annual CPI of close to 3.0 percent.
However, the oil price outlook has been thrown into disarray by the weekend dismissal of the Saudi oil minister Ali al-Naimi. So in the short-term I see little upward pressure on rates and therefore, the U.S. dollar.
Other short-term uncertainties that markets have to deal with are the potential for yet another Greek financial problem, a possible Brexit and looking out beyond three months the outcome of the U.S. election and subsequent government policy. As discussed below, all is not doom and gloom and regardless of current uncertainties and potential seasonal influences, I see markets continuing in a trading range.
Beyond Three Months: I will repeat two things mentioned in the past. Given the severity of the Great Recession, it will take longer than expected to achieve a full recovery. Reported economic data will likely continue to be volatile. Given current uncertainties Wall Street may over-react to what it perceives to be one or more potential negative trends.
However, on Main Street, attitudes are better and expectations are considerably higher as measured by the Michigan confidence indicators not to mention others. I look at four things: the number of consumers working, the hours they work, average year over year (YOY) hourly earnings’ (+ 2.2 percent latest reading) and the increase in the market value of their homes. All are favorable and auger well for the US automobile and housing industries, two key drivers of the US economy. On the industrial side, a positive indicator is the US ISM Purchasing Managers’ Production index is at 54.2 percent.
That said, there are some headwinds which some are extrapolating into potential future negative trends. For example, the US Industrial Production Index is down 2.0 percent YOY and has been in a declining trend since mid-2014. However, drilling down, one sees that the manufacturing index (73.9 percent of the IP index) rose 0.4 percent YOY which was not enough to offset the 7.7 percent decline in Utilities (10.9 percent of the index) and the 52 percent decline in Mining (15.5 percent of the index). Also, the volatile US Durable Goods have declined 0.3 percent YOY. Finally, US corporate capex has lagged for two reasons. a) the past impact of the rise in the $US; b) the focus on M&A as in many cases it is easier/cheaper to acquire than to build.
In summary, I see a trading range for markets until the Fall at which time I expect to see further improvement in the economy and stock markets even though the former is likely to continue to be “lumpy.”
Top Picks:
Agrium (AGU.TO)
Close as of 05/06: $108.93; One year price target: $118.50; Target Gain: 8.9 percent; Yield: 4.18 percent; Target Total Return: + 13.0 percent; Date and price of last purchase: 03.07/16 @ $116.20.
The downward pressure on fertilizers continues particularly potash as contract price and volume negotiations in China and India drag on. In Agrium’s case this has been reflected in an approximate 26 percent share price decline from early ’15. While the world is currently awash in supplies, we think this is a short-term phenomenum. Droughts such as currently in Brazil, unexpected high number of acres being planted in the US and in the longer term, chronic under fertilizer application in China and India particularly, speak to a long-term favorable demand. In Agrium’s case, its retail business has been a jewel in its crown. While we may see some further short-term price weakness, we think the negatives have been discounted.
Manulife (MFC.TO)
Close as of 05/06: $18.35; One Year Target Price: $21.75; Target Gain: 18.6 percent; Yield: 4.03 percent; Target Total Return: + 22.7 percent; \ Date and price of last
purchase: 12/10/15 @ $21.11
Worries about Manulife range from further write-offs from its oil exposure, continuing low interest rates and uncertain stock markets. In Q1 it wrote off $340 million of its energy investments vs $77 million in Q1/’15. Its current exposure to energy is $12.7 billion of which 95 percent is still investment grade. Most of the damage was from its exposure to alternative assets. Offsetting these worries is the current state of its basic businesses. For example, core earnings from its Asian business rose 33% (YOY), from Canada (30 percent) with the U.S. lagging at + 4 percent. We think the market has discounted some part of the negatives while not reflecting the positives. For example It’s current PER on ’16 EPS estimates is 9.9 compared to a ten year average of12.4 and a five year average of 11.8.
Canadian National Railway (CNR.TO)
Close as of 05/06: $76.65; One year price target: $82.30; Target Gain: 7.4 percent; Yield: 1.1 percent; Target Total Return: + 9.3 percent; Date and price of last purchase: 04/27/16 @ $78.45.
Q1 ’16 was a major challenge for all North American Class 1 railways. Volume trends were weaker than expected reflected in a 10.3 percent decline in RTM and 5.8 percent decline in carloads. A speedy reaction resulted in a decline of Dwell times and labor costs as well as an improvement in velocity, employee efficiency and customer pricing. Operating Ratios declined 3.1 percent. In recognition of the headwinds CN’s management reduced guidance to a flat ’16 compared to ‘15. Looking out to ’17 and ’18, consensus EPS estimates are for increases of 10.0 percent and 8.9 percent.In recognition of the current environment, the stock price has pulled back about 8.2 percent from a recent high of about $83.50. Given our favorable view about economic growth continuing in H2 ’16 and for the next several years, we think the stock is good value.
DISCLOSURE
| STOCK | PERSONAL | FAMILY | PORTFOLIO/FUND |
|---|---|---|---|
| MFC | N | Y | Y |
| CNR | N | Y | Y |
| AGU | N | Y | Y |
Toronto-Dominion Bank (TD.TO)
- Then: $56.17
- Now: $55.35
- Return: -1.46%
- TR: +2.47%
Apple (AAPL.O)
- Then: $132.65
- Now: $92.79
- Return: -30.05%
- TR: -28.37%
Agrium (AGU.TO)
- Then: $125.64
- Now: $109.61
- Return: -12.76%
- TR: -9.41%
Total Return Average: -11.77%
DISCLOSURE
| STOCK | PERSONAL | FAMILY | PORTFOLIO/FUND |
|---|---|---|---|
| TD | N | Y | Y |
| AAPL | Y | Y | Y |
| AGU | N | Y | Y |
Website: www.globe-invest.com


