Nov 6, 2023
Larry Berman: How high can this relief rally go?
By Larry Berman
Larry Berman's Market Outlook
VIDEO SIGN OUT
The history of business cycles is clear: they always end with a recession.
LABOUR DATA
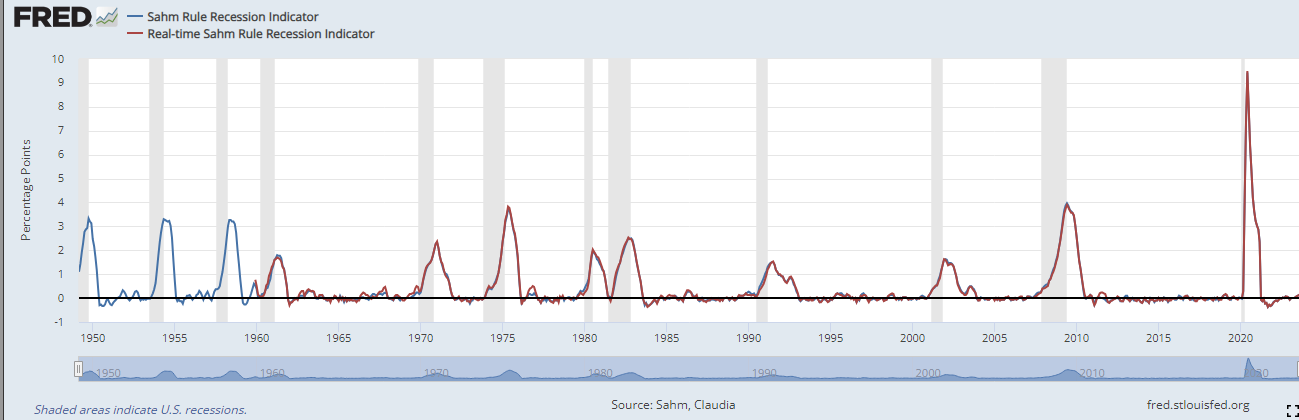
The Sahm Recession Indicator signals the start of a recession when the three-month moving average of the U.S. unemployment rate rises by 0.50 percentage points or more relative to its low during the previous 12 months. This indicator is based on real-time data, meaning it considers the unemployment rate (and the recent history of unemployment rates) that were available in a given month.
The U.S. Bureau of Labour Statistics revises the unemployment rate each year at the beginning of January, when the December unemployment rate for the prior year is published. Revisions to the seasonal factors can affect estimates in recent years. Otherwise, the unemployment rate does not revise. The current reading is 0.33 per cent – so it’s moving higher but has not triggered the signal yet. This indicator has never missed forecasting a recession.
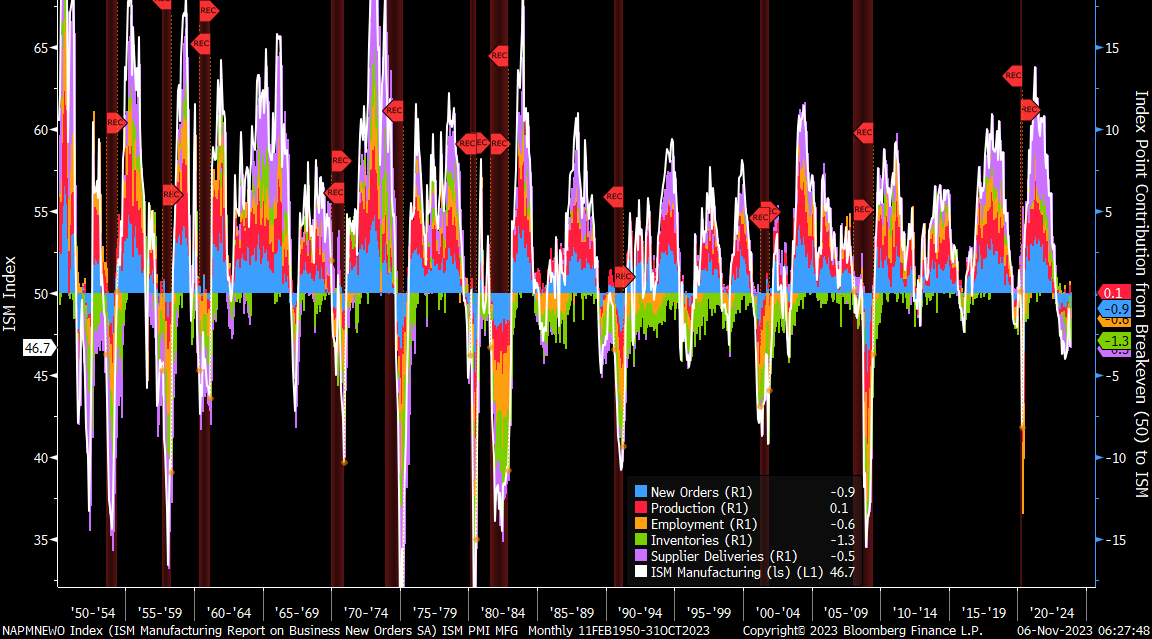
The Institute for Supply Management reports monthly on the components of manufacturing output. This is a major swing factor in periodic economic output. However, it’s consumption (or final consumer demand) that is 70 percent or more of GDP, and output is more cyclical. So ultimately, the income that supports consumption, such as jobs and earnings, is the key to recessions.
Manufacturing has been in recession for the past year, but much of that has to do with the imbalances that COVID-19 caused to manufacturing and supply chains and the rebalancing of “just-in-time” inventories to “just-in-case” inventories. The chart below is very busy, but pay attention to the troughs and how they align with historic recessions. Sometimes manufacturing contracts due to inventory corrections and we do not get a recession. When combined with the U.S. Federal Open Market Committee (FOMC) tightening interest rates aggressively, a recession has historically been a certainty.
CENTRAL BANK POLICY
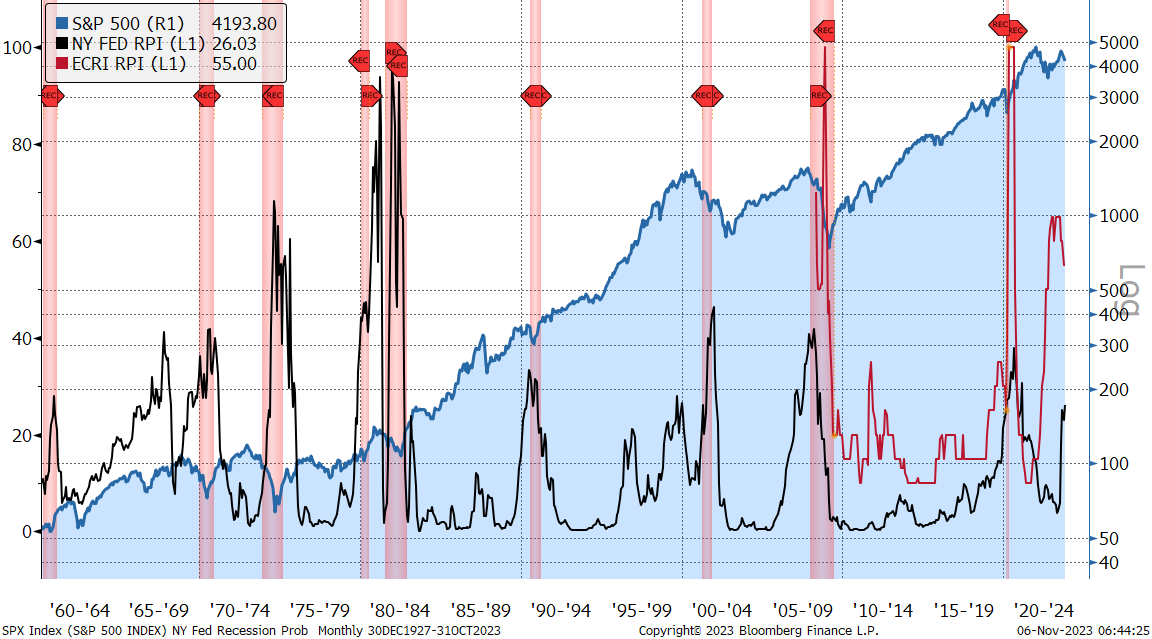
Historically, the yield curve moves in response to central bank policy as we move through the business cycle and react to policies implemented to control inflation, namely, changing short-term rates. Use the U.S. Fed’s balance sheet to monetize debt issuance through quantitative easing or tightening has become a huge factor in the shape of the yield curve after the Great Financial Crisis. The New York Fed has a simple model by looking at the three-month rate compared to the 10-year rate and when the curve inverts, the probability of recession is high, due to the fact that Fed policy is restrictive and trying to cool inflation and the economy.
This is where we are today and the odds of a recession are very high. There are other cyclical-type indicators that forecast recession like the ECRI recession probability indicators that are based on a compilation of leading economic indicators.
The FOMC clearly pushed the pause button last week, which was a bit surprising to the markets. Clearly reiterating the higher-for-longer message, the U.S. Fed emphasized that long rates rising are helping to slow the economy and inflation. Of course, the conundrum is that bond yields fell in response and are now pricing in some easing that will only come with a hard landing.
U.S. TREASURY MOVES
Perhaps the biggest factor behind the rally last week was that U.S. Treasury Secretary Janet Yellen chose to use more T-Bills to fund the deficit and quantitative tightening needs versus the expectation of increased longer end bond supply. When the Treasury uses bills over bonds, it can have a meaningful impact on market liquidity, which it clearly did last week.
WHERE DO THINGS GO FROM HERE?
All these factors combined to create a surprise to the market, prompting a short covering and risk-on rally. But none of them change the odds of a recession or that trillions of new bonds are needed to fund the government in the coming years. Yellen kicked the rate pressure issues into 2024 (an election year in the U.S.) and the rate hike pause button from the FOMC relieved some concerns too. Meanwhile, the labour market cooled in a Goldilocks way, making the FOMC look prescient in their soft-landing desires.
We remain in the hard landing camp, like we have seen historically at the end of every business cycle. To think this time is different is probably naive. But forecasting how each wiggle will play out is near impossible. Always try to keep your eye on the most likely outcome and be willing to dance a bit around the noise. This dance is a combination of a delicate limbo and a violent break dance at the same time — it will not be easy. Don’t look for the markets to break the July highs, but the October lows probably hold too until the factors that caused the shift last week – Treasury, FOMC, jobs – start telling a different story.
Follow Larry:
YouTube: LarryBermanOfficial
Twitter: @LarryBermanETF
Facebook: @LarryBermanETF
LinkedIn: LarryBerman
www.etfcm.com