May 26, 2016
Daniel Straus Top Picks: May 26, 2016
, BNN Bloomberg

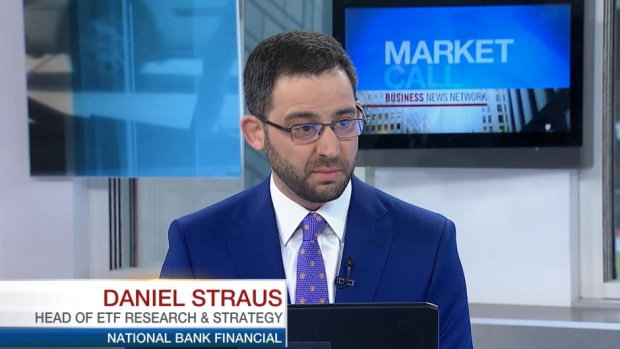
Daniel Straus, Head of ETF Research & Strategy, National Bank Financial
FOCUS: ETFs
_____________________________________________________________
MARKET OUTLOOK:
With the ever-growing number and variety of ETFs in the Canadian marketplace, not to mention the U.S., investors have unprecedented power and freedom to create low cost, efficient, and diverse portfolios with exposure to nearly every asset class under the sun.
As of May 2016, there were 450 ETFs in Canada and over 1,900 ETFs in the U.S. With this expanded product selection comes a greater number of decisions and potential pitfalls as investors navigate the array of choices.
We first begin with National Bank’s asset allocation views from our Economics and Investment Strategy Team. These are broad and diversified asset allocation schemes with six basic asset class lines: Canadian, U.S., and International Equities, Bonds, Alternatives, and Cash. We take two specific directions for exposure in each asset class:
- Passive Core for broadest and least expensive exposure – we seek out the ETF with the best quantitative metrics in terms of fees, transaction costs, diversification, and liquidity.
- Strategic Satellite for factor-based or actively managed exposure – where appropriate, we supplement each passive “core” with a strategic ETF that can be alternatively weighted, factor index-based, or actively managed.
Currently our economics team is overweight equities relative to fixed income, and within that category there’s been a gradual switching from U.S. and International stock markets back into Canada during our quarterly rebalance dates. Moving by asset class:
Canadian Equity: Despite the fact that a new reality of commodity prices is setting in, the Canadian economy is showing signs of resilience. First, oil prices have moved up. Second, labour market conditions and other domestic economic indicators look positive. We had strong gains in full-time and private-sector jobs, and higher than expected CPI data for two months in a row (March and April).
U.S. Equity: Albeit haltingly, the U.S. economy continues to expand as well. The probability of a June hike remains low as weak profits have been harming business investments, which has been falling lately. Discouraging payroll and wage growth notwithstanding, the unemployment rate is hovering near multi-year lows at 5 percent and consumer confidence remains high. On the currency front, our model ETF portfolios went from unhedged to currently employing a partial hedging strategy, although there are arguments to be made on both sides in this debate.
International equity: Here we find a higher concentration of risk. The year kicked off with global concerns over a recession in China and falling crude prices, but since mid-February most foreign benchmark indices have recouped their losses. However, risks are still prevalent as global GDP is expected to be relatively slow at 3 percent despite widespread monetary easing policies from central banks the world over. Many factors can reverse the current gains: Brexit, commodity prices (USD strength), rate hikes, sluggish growth, corporate earnings, China, et cetera. Looking internationally, opportunities are there to be found, but we want to be selective in our asset allocation and ETF choices.
Fixed Income: Our asset allocation team suggests that there’s a fundamental tension in the bond markets, in that the Fed wants to tighten (perhaps slowly, perhaps in the long run), but yields have priced in some dovish policy. Although the current outlook for bonds can be challenging, especially in the investment grade universe, it’s important to remember the role that bonds play in an overall portfolio context. Rather than chasing yields and absolute returns, long-term investors should select bond ETFs that fulfill the wider investment goal of diversification and risk mitigation. Hopefully, when yields finally start to rise, the bond portfolio can gradually pick up yield as the investor rebalances among asset classes. Given the liquidity and transparency of many bond ETFs, they offer a tremendous value proposition, especially when compared with traditional cash bonds. Our model portfolios use aggregated bond exposure as the core anchor, supplemented by some investment grade, short term, and global bond ETFs to bring down duration risk and add diversification.
Top Picks:
ETF “Picks” or example selections from NBF ETF Model Core Portfolios
Ishares S&P TSX Capped Composite Index Fund (XIC.TO)
XIC is our pick for the core exposure for Canadian equity. All of the broad Canadian equity ETFs offered by iShares, Vanguard and BMO charge extremely low expense ratios of 5 bps. Given its $2.5 billion asset bases and high liquidity, XIC is our go-to product when we want to leg back into Canadian equity during a recovering oil market. XIC is our core Canadian passive equity position across all 5 model ETF portfolios, which we supplement with different factor ETFs depending on the risk profile.
Horizons Active Global Dividend ETF (HAZ.TO)
HAZ is our pick for the strategic supplement in our international equity component. It is actively managed by sub-advisors at Guardian Capital. HAZ’s managers use quantitative screens to select international equity securities listed on North American exchanges that show a consistent pattern of growing dividends, as well as other growth and profitability metrics. As a result, it adds an income theme to our foreign equity allocation as well as a moderate element of risk management through the active mandate. In the past year, HAZ had total returns of 3.29 percent, and the MSCI World in CAD terms had 0.36 percent returns.
Vanguard Canadian Aggregate Bond Index ETF (VAB.TO)
VAB is our pick for part of the core Fixed Income exposure in the Canadian market. However, as we explain in our report, on its own this ETF probably has too much duration risk for the average Canadian investor. We mix it with a combination of short-term corporate bond ETFs like ZCS and HFR, then add some global bonds for diversification. That said, VAB is a good “anchor” to a fixed income portfolio because of its very low MER (0.19 percent) and excellent tracking with the overall Canadian bond market. VAB’s performance in the past year has been positive at 3.58 percent. But like most aggregate bond ETFs, VAB must hold issues of all maturities (including some very long bonds), and its recent returns may be a consequence of its long duration of 7 years. Given its low yield to maturity (1.90 percent), its return potential isn’t attractive on its own merits (especially after taxes), but that’s the reality of the bond market today.
| Disclosure | Personal | Family | Fund/Portfolio |
|---|---|---|---|
| XIC | N | N | N |
| HAZ | N | N | N |
| VAB | N | N | N |


